Multiple charts exist which predict another recession soon!
Normally I am a very positive person. But recently I found not one but two charts which show we could have a repeat of the recent Great Recession.
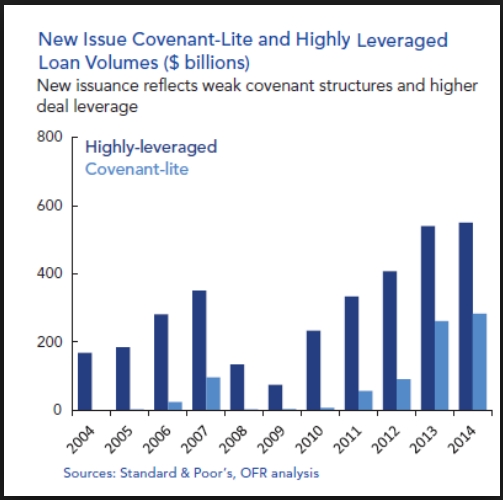
The first chart above shows how the Federal Reserve and Quantitative Easing have allowed financial institutions to run wild again. In summary, leveraged lending is out of control. For two years, leveraged loans have risen as fast and to a greater level than 2007, the year before the Great Recession.
The New York Times reports that leveraged lending is greater and the associated rules more lax than in 2007. Here is a portion of a news report.
What can’t be denied, however, is that standards in the leveraged loan market have become much looser in recent years. The companies that have taken out the loans are on average much more indebted than in recent years. Companies that have done deals this year have debt that is 4.9 times as large as their annual cash flows, measured using earnings before subtracting expenses like interest, taxes and depreciation, according to data from Standard & Poor’s Capital IQ. That multiple is up from 3.9 times in 2011 — and it is the same as the number for 2007, when the last boom in leveraged loans peaked.
This time around, however, one aspect of leveraged lending is much more aggressive. The special provisions within loan agreements that were once thought crucial for protecting creditors are fast disappearing. So far this year, 63 percent of leveraged loan deals lack such provisions, far higher than 25 percent in 2007, according to data from S.&P. Capital IQ. “Contractually, things are really at their weakest,” said Christina Padgett of Moody’s Investors Service.
You can read more details at one of these websites:
http://dealbook.nytimes.com/2014/11/04/a-recent-surge-of-leveraged-loans-rattles-regulators/?_r=0
http://www.zerohedge.com/news/2015-04-09/oil-hedges#comment-5977321
http://www.bloomberg.com/news/2015-01-06/private-equity-deals-spur-leveraged-loan-surge.html
~~~~o~~~~
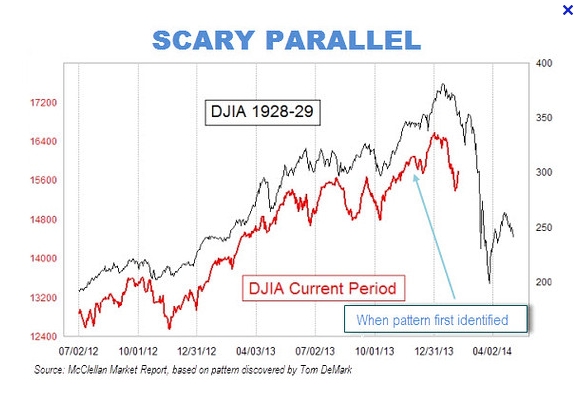
A second chart shows that recent Dow Jones record increases also occurred in 2008.
http://en.wikipedia.org/wiki/List_of_largest_daily_changes_in_the_Dow_Jones_Industrial_Average
Unfortunately 10 out of 20 increases of 400 or more of the Dow occurred in 2008, the year of the last recession
~~~~o~~~~
Can another Great Recession be stopped? No. Apparently the Federal Reserve did not act fast enough nor aggressive enough in 2014 to stop the out of control leveraged loans.
To protect yourself, read this website:
https://michaelekelley.com/2014/10/16/8-things-to-do-when-recession-happens/
Thanks for reading this.